0. 복습 내장 함수 : SQL에 내장되어 있는 함수 서브 쿼리 : 다른 쿼리 내부에 포함되어 있는 SELECT문 ( ) 소괄호를 감싸서 사용한다 서브 쿼리의 종류 WHERE절 : 서브쿼리 SELECT절 : 스칼라 FROM절 : 인 라인 뷰 1) WHERE절의 서브쿼리 메인쿼리의 WHERE절에 사용하는 SELECT (1) 단일 행 서브쿼리 : 서브쿼리 실행결과로 1개의 행이 조회되는 것 사용하는 연산자 : 관계(비교) 연산자 : >, <,... (2) 다중 행 서브 쿼리 : 서브쿼리 실행 결과로 여러 개의 행이 조회됨 사용하는 연산자 : IN( ), ALL( ), ANY( ) (3) 다중 컬럼 서브쿼리 : 여러 개의 컬럼에 대한 조건을 한 번에 비교할 때 사용 1. 서브쿼리 1) 스칼라 서브쿼리 메인 쿼리의 SELECT문에서 SELECT문 사용 반드시 1개의 행, 1개 칼럼만 반환하는 서브쿼리 (여러 행이 반환되면 오류 발생 ) 2) 인 라인 뷰 (In Line View) 메인 쿼리의 FROM절에 SELECT문 사용 가상 테이블을 만드는 효과 2. SQL문 종류 1) DDL (Data Definition Language) : 데이터 정의어 관계형 데이터 베이스의 구조를 정의함 테이블 조작 또는 제어 관련 쿼리문 CREATE, ALTER, DROP, TRUNCATE 2) DML (Data Manipulation Language) : 데이터 조작어 테이블에서 데이터를 입력, 수정, 삭제, 조회함 INSERT, UPDATE, DELETE, SELECT 3) DCL (Data Control Language) : 데이터 제어어(권한) 데이터베이스 사용자에게 권한을 부여, 회수함 GRANT, REVOKE 4) TCL (Transaction Control Language) : 트랜젝션 제어어 트랜젝션 (작업 단위)을 제어하는 명령어 COMMIT, ROLLBACK, SAVEPOINT 3. DML 테이블에서 데이터를 추가, 수정, 삭제, 조회하기 위한 SQL문 => 데이터 조작어 WHERE 절로 조건을 생성하여 원하는 조건을 검색한 다음, 데이터 수정, 삭제, 조회를 수행한다 1) SELECT : 조회 SELECT 컬럼명,... FROM 테이블명 [WHERE 조건]; 2) INSERT : 추가 테이블명 - 컬럼명- 데이터 순서로 입력 INSERT INTO 테이블명(컬럼명,...) VALUES(값,...) -- 원하는 컬럼만 골라서 값을 저장할 때 사용 INSERT INTO 테이블명 VALUES(값,...); -- 모든 컬럼에 값을 넣을 때 사용한다 3) UPDATE : 수정 UPDATE 테이블명 SET 컬럼명1 = 값1 , 컬럼명2 = 값,... [WHERE 조건]; ** 주의! 만약 WHERE절을 생략하면 내가 선택한 컬럼의 모든 행의 값이 수정됨!** 4) DELETE : 삭제 DELETE FROM 테이블명 [WHERE]조건; 주의! WHERE절을 생략하면 모든 행의 데이터가 지워진다 DELETE는 "삭제여부"만 표시함 => 용량 초기화 X => 테이블 용량 감소 X TRUNCATE 문은 테이블의 데이터 삭제 & 용량 초기화 O => 테이블 용량 감소 (테이블의 데이터를 모두 삭제한 후 테이블 공간을 초기화함) +) 실습 강사님은 컬럼명 안 쓰고 그냥 NULL 집어넣음 INSERT INTO TBL_STUDENT VALUES(1, '김철수', 90, 90, 90, NULL) --A학점 UPDATE TBL_STUDENT SET STUDENT_GRADE = 'A' WHERE (STUDENT_MATH + STUDENT_ENG + STUDENT_KOR) /3 >= 90; --B학점 UPDATE TBL_STUDENT SET STUDENT_GRADE = 'B' WHERE (STUDENT_MATH + STUDENT_ENG + STUDENT_KOR) /3 >= 80 AND (STUDENT_MATH + STUDENT_ENG + STUDENT_KOR) /3 < 90 ; --C학점 UPDATE TBL_STUDENT SET STUDENT_GRADE = 'C' WHERE (STUDENT_MATH + STUDENT_ENG + STUDENT_KOR) /3 >= 50 AND (STUDENT_MATH + STUDENT_ENG + STUDENT_KOR) /3 < 80 ; --F학점 UPDATE TBL_STUDENT SET STUDENT_GRADE = 'F' WHERE (STUDENT_MATH + STUDENT_ENG + STUDENT_KOR) /3 < 50; SELECT * FROM TBL_STUDENT; -- +) UPDATE의 CASE문 -- *SELECT의 CASE문 -- SELECT -- CASE -- WHEN 조건 THEN결과 -- ... -- END; -- UPDATE에서 사용 -- UPDATE 테이블명 -- SET 컬럼명 = -- CASE -- WHEN 조건 THEN 결과 -- ... -- ELSE -- END ; UPDATE TBL_STUDENT SET STUDENT_GRADE = CASE WHEN(STUDENT_MATH + STUDENT_ENG + STUDENT_KOR)/3 >=90 THEN 'A' WHEN(STUDENT_MATH + STUDENT_ENG + STUDENT_KOR)/3 >=80 THEN 'B' WHEN(STUDENT_MATH + STUDENT_ENG + STUDENT_KOR)/3 >=50 THEN 'C' ELSE 'F' END; -- + 집계함수 : AVG(칼럼명) => 해당 칼럼의 평균 -- 평균 점수 => 행마다 국어, 영어, 수학의 평균 => AVG() X 4. DDL 관계형 데이터베이스는 릴레이션(relation)에 데이터를 저장, 관리한다 릴레이션은 DBMS에서 테이블로 생성된다 그래서 데이터 베이스를 사용하기 위해서는 테이블을 먼저 생성해야 한다 DDL은 관계형 데이터 베이스의 구조를 정의하는 언어 = 테이블 생성, 변경, 삭제를 위한 언어 1) 테이블 생성 : CREATE TABLE 새로운 테이블 생성 기본키(PK), 외래키 (FK)등 제약조건 (제약사항) 설정 CREATE TABLE 테이블명( 컬럼명 자료형 (용량)[제약조건], ... ); +) 자료형 (데이터 타입) number : 숫자형 타입 varchar2 : 가변길이 문자열 ex) varchar2(100): 100글자까지 저장할 수 있는 문자열 char : 고정된 크기의 문자열 ex) char(2) : 2개의 글자만 저장할 수 있는 문자열 date : 날짜형 타입 2) 테이블 수정 : ALTER ALTER TABLE 테이블명 - 테이블 명 수정 : RENAME TO 새로운 테이블명; - 컬럼 추가 : ADD(컬럼명 자료형); - 컬럼명 수정 : RENAME COLUMN 기존컬럼명 TO 새컬럼명; - 컬럼 삭제 : DROP COLUMN 컬럼명; - 컬럼 타입 수정 : MODIFY(컬럼명 자료형) 3) 테이블 삭제 : DROP TABLE DROP TABLE 테이블명; 4) 테이블 내용 전체 삭제 : TRUNCATE TRUNCATE TABLE 테이블명; 5. 제약조건(CONSTRAINT) 1) 기본키 : PRIMARY KEY(PK) 고유값이며 각 행의 구분점으로 사용된다 중복이 없고 NULL값을 허용하지 않는다 ``` 제약조건의 이름을 설정하지 않응면 오라클이 자동으로 만들어준다 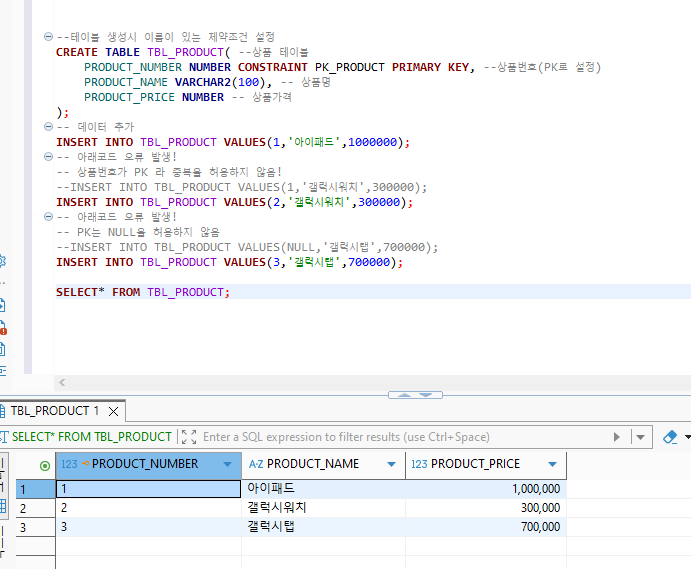 2) 외래키 : FOREIGN KEY(FK) 다른 테이블의 PK를 사용하며 중복이 가능하다 NULL도 허용 보통 테이블끼리 관계를 맺을 때 사용한다 3) NOT NULL : NULL을 허용하지 않는다 4) CHECK(컬럼명 =값, 컬럼명 = 값) 특정 컬럼에 특정 값만 허용하고 싶을 때 사용하는 제약조건 (우리가 원하는 값이 들어왔는지 체크한다) ex) CHECK(GENDER ='M'OR GENDER ='F') => GENDER라는 컬럼에 M혹은 F만 허용 5) DEFAULT : 해당 컬럼에 값을 추가하지 않으면 디폴트로 설정한 값이 들어간다 (기본값 설정) 6) 복합키(조합키) 두 개 이상의 컬럼을 KEY(PK)로 설정하는 것 테이블에 한 개의 PK만 존재할 수 있다 복합키를 사용하면 두 개 이상의 컬럼을 하나의 PK로 사용할 수 있다
Automated Fare Collection System Market Outlook 2026: Emerging Trends, Competitive Landscape & Future Opportunities The Automated Fare Collection System Market is witnessing strong growth as public transportation networks increasingly adopt digital ticketing, contactless payments, smart cards, mobile ticketing, and integrated fare management solutions. Growing urbanization, smart-city initiatives, and demand for convenient and cashless transportation are creating significant opportunities for market participants. According to Transpire Insight, the global Automated Fare Collection System Market was valued at USD 14.72 billion in 2025 and is projected to reach USD 28.91 billion by 2033, expanding at a CAGR of 8.96% during 2026–2033. Get the full PDF sample copy of the report: https://www.transpireinsight.com/request-sample/8387 Increasing adoption of contactless payments, NFC, mobile wallets, QR codes, and smart cards is supporting market expansion. Automated fare collection systems help transport operators improve payment efficiency, reduce cash handling, streamline passenger movement, and strengthen revenue management. The growing adoption of smart transportation and integrated mobility platforms is creating additional opportunities. Transport authorities are increasingly deploying automated gates, validators, mobile ticketing, back-office software, and account-based ticketing solutions. Get Instant Access with Exclusive Savings on This Report @ https://www.transpireinsight.com/buy-report/8387 Digitalization is further transforming the market through cloud-based platforms, real-time analytics, IoT connectivity, and digital payment technologies. These solutions enable transaction monitoring, fraud detection, passenger-flow analysis, and more efficient transportation operations. Regionally, North America represents the leading market, while Asia-Pacific is another major market supported by smart-city investments and transportation modernization. Europe is identified as the fastest-growing region in the Transpire Insight analysis. Market Leaders & Key Stakeholders Cubic Transportation Systems Thales Group Conduent Scheidt & Bachmann Indra Sistemas Hitachi Rail INIT GmbH LG CNS NEC Corporation Xerox Flowbird Group Samsung SDS Huawei Masabi Which emerging trends are influencing the Automated Fare Collection System Market sector, and what strategies is your business implementing in response? The Automated Fare Collection System Market is being transformed by the rapid adoption of contactless payments, mobile ticketing, smart cards, QR-based ticketing, account-based systems, and integrated mobility platforms. Another important trend is the increasing adoption of NFC, EMV, mobile wallets, and open-loop payment systems. These technologies allow passengers to use bank cards and smartphones for faster and more convenient fare payments. The growing deployment of cloud-based fare collection and real-time data analytics is also creating opportunities. Cloud platforms can support transaction monitoring, revenue management, fraud detection, system integration, and passenger-flow analysis. The market is also benefiting from smart-city transportation initiatives and multimodal mobility integration. Governments and transit authorities are investing in digital fare systems that connect buses, metro, rail, parking, and other transportation services. To explore comprehensive market analysis, competitive benchmarking, regional insights, company profiles, and future forecasts, download the exclusive Automated Fare Collection System Market report from Transpire Insight: https://www.transpireinsight.com/report/automated-fare-collection-system-market Product innovation, contactless payment technologies, cloud integration, mobile ticketing, real-time analytics, cybersecurity, and multimodal transportation integration are becoming important strategies for companies responding to evolving mobility requirements. About Us: Transpire Insight Transpire Insight is a Data analytics research and business Consulting Company providing quality insights that help businesses identify opportunities, navigate market challenges, and make data-driven decisions. Website: https://www.transpireinsight.com/
01 VectorRetriever : 의미 기반 검색 질문 임베딩 질문과 유사한 청크 검색 같은 영화의 중복 청크 제거 → 기준 영화 후보 VectorCypherRetriever : 의미 검색 + 그래프 관계 확장 질문 벡터 → 진입 청크 찾기 청크 → 원문 → 기준 영화 기준 영화 → 공통 배우 → 다른 영화로 확장 paths에 공통 배우 + 양쪽 관계 claim_id 저장 같은 후보 영화 중복 병합 전문 검색 질문 언어 판단 검색용 핵심어 변환 Neo4j Full-text(BM25) 검색 같은 원문은 최고 점수 청크만 유지 source_id로 Vector 결과와 비교 Vector = 의미로 찾기 Graph = 관계로 확장하기 Full-text = 단어로 찾기 # (1) 의미기반 검색 VectorRetriver # (2) 의미 + Cypher 확장 검색 VectorCypherRetriever # (3) 전문 검색 02 질문을 역할별로 나눔 의미/줄거리 검색용 질문 그래프 관계 조건용 질문 세 가지 검색 전문 검색 → BM25 벡터 검색 → Dense 그래프 검색 → GraphCypherQAChain 자연어 질문 → LLM이 Cypher 생성 → Neo4j 조회 → 관계 후보 반환 검색 결과 통합 전문 + 벡터 → EnsembleRetriever → 가중 RRF 그래프 검색 결과의 source_id → 관계 조건을 만족하는 allowed_ids 관계 조건 적용 RRF 결과 중 allowed_ids에 속하는 후보만 유지 그래프에는 있지만 전문/벡터 검색이 놓친 후보 → search_score = 0으로 뒤에 추가 PageRank 재랭킹 그래프 전체에서 노드 중요도 계산 검색 점수 + PageRank 점수 결합 final_score로 후보 재정렬 Multi-hop 근거 구성 기준 영화 → 배우 → 후보 영화 first_claim / second_claim으로 관계 근거 추적 후보 원문 + 영화 정보 + 관계 evidence 수집 답변 상위 후보의 원문/관계 근거를 LLM에 전달 evidence_id를 인용해 최종 답변 # 원래 질문 (의미기반 검색 + 필터 검색) # 원래 질문 LLM을 활용해서 -> 의미기반 검색 질문 + 그래프 기반 검색 질문으로 나눔 # 의미기반 검색 질문 -> 하이브리드 검색으로 점수 및 검색 결과를 도출 # 그래프 기반 검색 질문 -> TextToCypher를 활용해서 검색 결과를 도출 --> (필터 조건을 만족하는 검색 후보) # 의미기반 후보들의 점수를 그래프 기반 후보들에 대입 (없는 요소면 0점으로 대입) # 최종 후보들 도출 # 최종 후보들 PageRank의 포화함수 점수를 이용해서 재정렬 (선택사항) # 정렬된 최종 후보들로 Context 생성 # LLM을 활용해서 최종 답변
소마 프로젝트의 핵심 기능은 음식 사진을 AI에게 보내 어떤 음식인지 판별 하는 것이다. 백엔드 팀원이 이미 Gemini API로 이 기능을 구현해둔 상태였다. 소마는 지원비가 넉넉해서 비용 걱정이 없었고, 마침 새로 나온 Gemini Flash 모델이 이미지 식별을 아주 잘한다는 소식도 있었다. 팀원은 자연스럽게 Gemini Flash 3.8 을 골라 구현을 마쳤다. 앱에서 직접 테스트해보면 잘 되는 것 같긴 했다. 그런데 3가지 질문이 자연스럽게 따라왔다. 이게 정말 잘 되는 게 맞나? 정확도가 높은건지.... 낮은건지... 추론에 8~10초씩 걸리는데, 더 줄일 수는 없나? 나중에 지원금 없이도 이 서비스를 유지하려면 api 호출 비용을 더 절약하고 싶은데... 당장 떠오른 아이디어, 또 바로 떠오른 그에 대한 반박 추론 시간을 줄일 방법으로 세 가지를 제안했다. 더 경량화된 모델을 쓰는건 안될까? 이미지 해상도를 줄여서 보내면 추론이 빨라지지 않을까? 이미지를 압축해서 파일 크기를 줄이면 더 빨라지지 않을까? 그런데 당장 떠오른 아이디어에는 당장 떠오른 반박도 있었다. ᄒ 너무 경량화된 모델은 부정확하지 않을까? 어쩌면 지금 모델이 이미 최선 아닐까? 속도 조금 챙기려고 사진크기 줄였다가 정확도가 너무 떨어지는 건 아닐까? Gemini Flash가 멀티모달이라지만 근본적으로는 LLM인데, 내부적으로 결국 토큰으로 변환해서 처리한다면 해상도가 같을 때 파일 크기는 의미가 없는 것 아닐까? 결국 "모델을 더 경량화해서 속도를 챙기자!"라고 주장하려면, 모두가 납득할만한 이유 가 필요했다. 이것이 AI 성능 프로파일러 를 만들게 된 계기다. 오늘은 내가 바이브코딩 요리사~ 이 도구에서 정말 중요한 건 무엇을 측정하고, 무엇을 비교할지에 대한 설계 와 그 프로파일링 결과 다. 도구 자체를 손으로 짜는 건 별 의미가 없다고 판단해서, 개발은 클로드에게 전적으로 맡기는 풀 바이브코딩을 해보기로 했다. ᄏᄏ 기술 스택도 마찬가지였다. 어차피 로컬에서 돌려 결과를 얻고, 그걸 정적 페이지로 만들어 GitHub Pages에 올려 팀원에게 공유할 생각이었기 때문에 스택이 중요하지 않았다. 그래서 기술 스택 선택도 클로드에게 전부 맡겼다. 내가 지시한 프롬프트는 이게 전부였다. 프로파일링할 모델을 선택할 수 있어야 하고, 원본 이미지 + 512/256 리사이즈 2개 + 85%/50% 압축 2개, 이렇게 5개의 대조군을 가져야 하고, API 1회당 응답 시간과 정답 여부를 계측할 수 있는 시스템. 그리고 프로파일링 뷰에서는 두 측정 결과를 나란히 비교해서, 뭐가 더 나은지 시각적으로 한눈에 볼 수 있는 화면. 물론 이후로 ui나 더 필요할 것 같은 통계 정보는 추가적인 프롬프트를 입력해서 개선해나갔다. 어쨌든 "모델이 얼마나 잘 맞추는데?"라는 질문에 감으로만 답하는 게 싫어서, 이런 시스템을 만들었다. 그런데 만들면서 깨진 경험 이 인상적이었어서 블로그에 남겨보려한다. 바이브코딩? AI? 절대 그를 신뢰하지마.... 가장 테스트하고 싶었던 건 Gemini Flash로 정확도가 충분한지 , 그리고 flash-lite 같은 더 경량화된 모델을 써도 괜찮을지 였다. 그래서 이 두 모델로 측정을 시작했다. 만족스러운 결론을 얻지 못했다면 다른 모델도 측정해봤겠지만, 스포를 하자면 다른 모델을 더 해볼 이유는 없었다. ᄏᄏ Google AI 콘솔에 크레딧을 만 원 정도 충전하고 프로파일링을 돌렸다. 요금표 기준 가격은 다음과 같다. 모델 입력 (100만 토큰당) 출력 (100만 토큰당) Flash 3.8 $0.75 $3.75 Flash Lite 3.5 $0.30 $2.50 참고로 내년부턴 가격이 2배 오른다.... 호출 한 번을 넉넉하게 잡아보자. 입력 : 이미지(256 리사이즈면 258토큰, 원본 사진도 1,500토큰 안팎) + 프롬프트 해서 약 1,000토큰 출력 : 음식 이름 JSON 몇십 토큰 그러면 flash 3.8은 1회당 약 $0.001(약 1.4원), flash-lite는 약 $0.0004(약 0.6원) 수준이다. 이미지 715개 × (원본 + 리사이즈 2개 + 압축 2개) = 모델당 3,575회 호출 . 두 모델을 다 돌려도 $5 안팎, 7천 원 남짓 이라는 계산이 나온다. 단순 계산으로는 절대 만 원을 넘을 수 없는 양 이었다. 그런데...! flash-lite 3.5는 문제없이 프로파일링을 마쳤는데, flash 3.8을 돌리던 도중 만 원이 증발했다. 💸 flash 3.8은 추론 기능이 default로 설정되어있다..? 왜 안 알려줬어...클로드야... 콘솔의 사용량 내역을 뜯어보고 나서야 알았다. flash 3.8은 thinking(추론) 기능이 있고, 모델이 답을 내기 전에 속으로 생각하는 이 thinking 토큰이 전부 출력 토큰으로 과금 되고 있었다. 나의 행복회로 내에서는 "입력 = 이미지 + 프롬프트, 출력 = 음식 이름 JSON 몇십 토큰"의 흐름이었다. 그런데 실제로는 호출 한 번마다 눈에 보이는 응답 뒤에 수천 토큰짜리 thinking이 숨어 있었다. 출력 단가는 $3.75/1M로 입력의 5배인데, thinking이 호출당 1,500토큰만 붙어도 출력 비용은 예상($0.0002)의 약 30배($0.0058)가 되고, 프로파일링 예상 총 비용은 약 $24, 3만 원 이 되는 것이다.. 만 원이 중간에 증발할 만했다. 클로드는 내가 시킨대로 API를 기본값 그대로 호출했을 뿐이고, 그 기본값에 thinking이 켜져 있었을 뿐이다. 바이브코딩의 무서운 점은 코드가 안 돌아가는 게 아니라, 잘 돌아가는데 내가 모르는 방식으로 돌아간다 라는 점임을 실제로 사고를 쳐보면서 경험해볼 수 있었던 것 같다! 경험값으로 10,000원은 값싼거 아니었을까...?ᄒ 의도치 않은 측정에서 알 수 있었던 재밌는 사실 2가지 2가지였다. 추론 기능이 켜져있으면 정확도가 올라가는가? 추론 기능이 끄면 속도가 빨라지는가? 결과는 의외였다. 추론 기능의 유무는 정확도의 큰 영향을 주지 않을 정도로 정확도는 0.7%밖에 차이가 안났고, 속도는 4.4초나 빨랐다. 거기에 비용은 절반보다 더 적었다. 우리는 gemini api로 각 사진이 어떤 음식인지 판별 하기 위해서만 사용한다. 그렇기에 추가적인 추론이 크게 의미가 없었던 듯하다. 이번 실수에서 배운 것 💡 API 호출 비용도 계측해야한다! 나는 AI 성능 프로파일링을 할때 계측 해야할 것을 크게 호출 시간, 정확도 이 2가지로 보았지만, 사실 특히 더 중요한 가격 을 빼먹고 있었다. 처음부터 호출 비용을 측정하고 있었으면 내 예상보다 가격이 비싸게 진행되고 있음을 알 수 있었을 것이다! 사진 크기가 AI 성능에 큰 영향을 미칠까? 모델 비교와 별개로 꼭 확인하고 싶었던 게 있다. 이미지를 어떤 형태로 보내야 가장 효율적인가? 해상도를 줄이면(resize) 빨라질까? 정확도는 얼마나 떨어질까? 해상도는 그대로 두고 압축만 하면(JPEG 품질 85% / 50%) 어떨까? 하나의 original 사진을 resize(512, 256), 압축(q85, q50)로 변형하기 때문에 결과가 다르다면 분명 이 변형으로 생긴 것일 것이다. 1. 정확도: 해상도를 줄이면 조금 떨어진다 모델 original resize512 resize256 q85 q50 Flash 3.8 90.9% 89.2% 88.1% 90.0% 90.1% Flash Lite 3.5 85.3% 83.9% 83.3% 85.0% 83.4% 해상도를 줄일수록 정확도가 1~3% 정도 떨어진다. 256px까지 줄이면 가장 많이 떨어진다. q85는 원본과 사실상 같다. 파일 크기가 119KB에서 76KB로 줄었는데 정확도는 그대로다. q50은 Lite에서 resize만큼 떨어졌다. 다만 같은 설정으로 두 번 돌려봤더니 원본 정확도가 84.9%와 85.3%로 0.4% 차이가 났다. 그러니까 1% 안팎의 차이는 노이즈일 수 있다. 확실하게 말할 수 있는 건 "줄일수록 조금씩 떨어지는 경향이 있다" 정도뿐이다. 2. 속도: 평균의 함정 Flash 3.8에서 이상한 결과가 나왔다. 사진이 가장 작은 resize256이 평균 처리시간은 오히려 가장 길었다 (9.3초, 원본은 8.6초). DB를 뜯어보니 평균의 함정 이었다. 가끔 1분 넘게 걸리는 요청 이 섞여 있었고(최대 1~3분!), 이런 이상치 몇 건이 어느 변형에 걸리느냐에 따라 평균이 크게 흔들린 것이다. 그래서 분포를 그려보고 중앙값 으로 다시 비교했다. 모델 (중앙값) original resize512 resize256 q85 q50 Flash 3.8 3,676ms 3,574ms 3,584ms 3,621ms 3,524ms Flash Lite 3.5 1,535ms 1,501ms 1,484ms 1,536ms 1,503ms 중앙값으로 보면 어떤 변형이든 차이가 -100ms ~ +100ms밖에 안 난다. 해상도를 줄여도 추론이 빨라지지는 않았다. 3. 반전: 입력 토큰이 전부 똑같다 해상도를 줄였는데 왜 빨라지지 않을까? 이유가 궁금해서 변형별 입력 토큰 을 뽑아봤다. 다섯 변형의 입력 토큰이 전부 약 2,445개로 똑같았다. 427×640 원본도, 171×256으로 줄인 사진도, 50%로 압축한 사진도 전부 거의 같았다. 뒤통수맞은 느낌이었다. ᄏᄏᄏ 으악ᄏᄏᄏᄏ 이미지 입력 토큰이 항상 같기 때문에 gemini 3 계열은 내부적으로 이미지 사이즈가 무엇이든 고정된 크기로 변환해서 사용한다. 그렇기 때문에 입력토큰 크기가 일정했던 것이다. 이걸 알고 나니 앞의 결과가 전부 설명된다. 속도가 그대로인 이유 : 모델이 처리하는 토큰 수가 같으니 추론 시간도 같다. 물론 네트워크로 이미지가 전송되는 시간은 이미지 크기를 줄인 것이 살짝 더 빠를 것이다! 정확도가 떨어진 이유 : 토큰 수는 같아도 그 안에 담긴 정보가 다르다. 작은 사진은 원래 디테일이 사라진 상태로 같은 칸 수를 채우는 거라, 흐린 사진을 같은 크기 화면에 꽉 채워 보는 것과 비슷하다. 결국 해상도를 줄이는 건 속도도 비용도 그대로인데 정확도만 조금 잃는 선택 이었다. ᄏᄏ 4. 진짜 조절 레버: media_resolution 그럼 이미지 토큰을 줄이는 방법은 없을까? 찾아보니 이미지 토큰 수를 정하는 건 사진 크기가 아니라 요청 파라미터인 media_resolution 이었다. media_resolution 이미지 토큰 LOW 280 MEDIUM 560 HIGH (= 지정하지 않았을 때 기본값) 1,120 우리는 지금까지 전부 이 값을 지정하지 않았으니 HIGH로 돌아간 셈이다. 그래서 원본 사진으로 LOW / MEDIUM / HIGH를 각각 돌려봤다. Flash Lite 3.5 LOW MEDIUM HIGH 정확도 84.7% 86.0% 85.1% 입력 토큰 1,622 1,897 2,445 1,000건당 비용 $0.50 $0.58 $0.74 처리시간 (중앙값) 1,119ms 1,234ms 1,387ms Flash 3.8 LOW MEDIUM HIGH 정확도 91.2% 89.7% 91.6% 입력 토큰 1,622 1,897 2,446 1,000건당 비용 $1.54 $1.73 $2.18 처리시간 (중앙값) 2,398ms 2,403ms 2,559ms resize와는 결과가 완전히 달랐다. 정확도는 사실상 그대로다. 비용은 약 30% 줄었다. 입력 토큰이 2,445에서 1,622로 줄어든 덕분이다. 속도도 빨라졌다. 사진을 우리가 직접 줄이면 정보만 잃는다. 반면 media_resolution 을 낮추면 모델이 처리하는 양 자체가 줄어든다. 음식 종류를 판별하는 정도의 작업이라면 LOW로도 충분했다. 이 실험에서 배운 것 💡 앞으로 누군가 나에게 "A가 빠를까? B가 빠를까?" 라고 묻는 다면, "측정해봤어?" 라고 답할것이다...!!! "해상도를 줄이면 토큰이 줄고 빨라진다"는 너무 당연해 보여서 의심조차 안 했다. 그런데 측정해보니 별 차이가 없음을 알 수 있었고, 입력 토큰은 media_resolution 라는 입력 파라미터의 의해 고정되어있음을 뒤늦게 알 수 있었다. 직접 측정해보기 전까지 나의 직관을 무지성 신뢰하지 않아야겠다고 다짐할 수 있는 경험이었다...!!! 그래서, 결과를 정리해보면? Gemini Flash 3.8 Gemini Flash 3.8 - Low Gemini Flash Lite 3.5 Gemini Flash Lite 3.5 - Low 처음의 세 가지 질문에 답해보면 이렇다. 1. 정확도가 충분한가? Flash 3.8은 약 91%, Lite 3.5는 약 85%. 두 모델의 차이는 약 6%p다. 2. 추론 시간을 줄일 수 있나? 사진 크기나 압축으로는 줄일 수 없다. 방법은 세 가지다. thinking 끄기 media_resolution 을 LOW로 낮추기 Lite 모델로 바꾸기 3. 비용을 아낄 수 있나? media_resolution=LOW 만으로 정확도 손실 없이 약 30%를 아낄 수 있다. Lite로 바꾸면 Flash LOW 대비 추가로 약 1/3 수준까지 내려간다. 조합 정확도 처리시간 (중앙값) 1,000건당 비용 Flash 3.8 (기존 설정) 90.9% 3.7초 $2.11 Flash 3.8 + LOW 91.2% 2.4초 $1.54 Flash Lite 3.5 + LOW 84.7% 1.1초 $0.50 결국 선택은 정확도 6%p를 얼마의 가치로 볼 것인가 의 문제가 됐다. 우리 팀의 경우 정확도 6%는 사실 큰 수치가 아니라고 판단하였다. 왜냐하면 아래의 사진을 보면 이 6퍼센트도 과장된 수치임을 알 수 있기 때문이다. 사진을 보고 ai는 고추장진미채볶음이라고 판별했으나 사실 ai의 답도 어떻게 보면 답이라고 볼 수 있기 때문이다. 그렇기에 이런 사소한 정확도의 집중하기 보단 처리 시간과 비용의 이점이 더 큰 Flash Lite 3.5 의 입력 토큰이 가장 낮은 LOW 로 설정해서 사용하는 것이 가장 우리 프로젝트에 적합하다고 판단하였다.!! 🎉
Receiving precise cost estimates requires sharing comprehensive details about your relocation project. Logistics companies rely on specific data points to calculate fair pricing. Omitting critical information can lead to unexpected fees upon delivery. This overview details the exact data required for accurate bidding. Essential Data Points for Precise Estimates Exact Item Dimensions and Weight Providing precise measurements is critical for accurate cost calculation. Heavy furniture and oversized apparatuses require specific vehicle capacities. Logistics coordinators calculate weight distribution to ensure safe transport. Inaccurate dimensions can compromise vehicle safety and crew preparedness. Sharing exact specifications eliminates surprises on moving day. Origin and Destination Logistics Transport providers need complete address details for both locations. Understanding the layout of pick-up and drop-off sites is equally important. Steep driveways, multi-level stairs, and narrow doorways impact labor requirements. Sharing these structural details helps companies dispatch the right number of workers. Complete geographical data ensures realistic scheduling and pricing. Special Handling and Accessory Requirements Certain items demand specialized crating or rigging techniques. Informing the provider about delicate finishes or complex mechanics is vital. Trusted heavy equipment movers evaluate these accessory needs to ensure complete protection. Transparent communication about unique item requirements prevents operational delays. Detailed information allows teams to bring appropriate safety gear. Conclusion Transparent communication forms the foundation of an accurate moving estimate. Sharing precise dimensions, location layouts, and special handling needs prevents billing surprises. Comprehensive preparation ensures logistics teams arrive fully equipped for the job. Detailed planning guarantees a smooth, predictable, and successful relocation experience.
According to Kings Research analysis, the global precision medicine market size was recorded at USD 103.25 billion in 2025 and is projected to reach USD 266.09 billion by 2033 , growing at a CAGR of 12.77% over the forecast period from 2026 to 2033. Get the Full Detailed Insights Report: https://www.kingsresearch.com/report/global-precision-medicine-market-3169 The global precision medicine market is witnessing substantial growth as healthcare systems increasingly shift toward personalized approaches that use genetic, molecular, clinical, and lifestyle information to guide disease prevention, diagnosis, and treatment. Unlike conventional treatment models that generally follow a standardized approach, precision medicine enables healthcare providers to identify patient-specific characteristics and select therapies that are more likely to deliver effective outcomes. The growing availability of genomic data, advances in molecular diagnostics, artificial intelligence, and bioinformatics is strengthening the adoption of precision medicine across multiple therapeutic areas. Precision Medicine Market Overview Precision medicine integrates advanced technologies and clinical information to develop individualized healthcare strategies. Genomic sequencing, biomarker identification, companion diagnostics, pharmacogenomics, artificial intelligence, and data analytics are becoming increasingly important in precision healthcare. These technologies allow healthcare professionals and researchers to understand disease mechanisms at a deeper molecular level and identify treatment strategies based on individual patient characteristics. The increasing prevalence of chronic and complex diseases is one of the major factors supporting market expansion. Conditions such as cancer, cardiovascular disorders, neurological diseases, autoimmune disorders, and rare genetic diseases often demonstrate significant biological variation among patients. Consequently, the demand for targeted and individualized therapies is increasing. The growing investments in genomic research and precision therapeutics are also creating favorable opportunities. Pharmaceutical and biotechnology companies are increasingly incorporating biomarker-driven approaches into drug discovery and clinical development. This trend is improving the identification of suitable patient populations and supporting the development of targeted therapies. Key Highlights of the Precision Medicine Market The global precision medicine market was valued at USD 103.25 billion in 2025 . The market is projected to reach USD 266.09 billion by 2033 . It is expected to expand at a 12.77% CAGR from 2026 to 2033. Oncology represents a major application area for precision medicine. Genomic technologies and molecular diagnostics are supporting personalized treatment decisions. Growing adoption of artificial intelligence and data analytics is transforming precision healthcare. Increasing investment in personalized therapeutics and companion diagnostics is creating new growth opportunities. Growing Role of Genomics in Precision Medicine Genomics is at the core of precision medicine because genetic information can reveal an individual's susceptibility to certain diseases and potential response to specific treatments. Technological improvements have made genetic sequencing faster and more accessible, enabling healthcare organizations and research institutions to process large volumes of genomic information. Next-generation sequencing technologies are increasingly used to identify genetic mutations, biomarkers, and molecular abnormalities. In oncology, genomic profiling can help physicians identify mutations associated with specific cancers and select targeted therapies accordingly. Pharmacogenomics is another important area of development. By studying how genetic variations influence an individual's response to medicines, healthcare providers can potentially reduce adverse drug reactions and improve therapeutic effectiveness. As genomic testing becomes more integrated into clinical workflows, its contribution to precision medicine is expected to increase. Artificial Intelligence and Data Analytics Accelerate Market Growth The increasing integration of artificial intelligence (AI), machine learning, and advanced analytics is creating new opportunities for the precision medicine market. Precision healthcare generates enormous amounts of data from genomic sequencing, electronic health records, medical imaging, laboratory testing, wearable devices, and clinical studies. AI-based platforms can analyze these datasets to identify patterns and relationships that may be difficult to detect using traditional methods. Healthcare organizations can use predictive analytics to support disease-risk assessment, patient stratification, and treatment planning. In drug development, AI can also assist researchers in identifying potential therapeutic targets and predicting drug responses. The combination of AI and precision medicine can therefore contribute to more efficient research processes and increasingly personalized healthcare strategies. Market Growth Drivers Rising Prevalence of Chronic and Complex Diseases The increasing global burden of cancer, cardiovascular diseases, neurological disorders, diabetes, and autoimmune diseases is driving demand for more effective and individualized treatment approaches. Many of these conditions have complex biological mechanisms and vary considerably between patients. Precision medicine helps address this variability by incorporating molecular and genetic information into clinical decision-making. As healthcare providers focus more strongly on improving patient outcomes, the adoption of personalized treatment strategies is expected to increase. Increasing Adoption of Targeted Therapies Targeted therapies are becoming increasingly important in modern healthcare, particularly in oncology. These therapies are designed to act on specific molecular targets associated with disease progression. The growing use of biomarker testing and companion diagnostics supports the identification of patients who are most likely to benefit from targeted treatments. This is encouraging pharmaceutical companies to develop therapies alongside diagnostic tests, strengthening the overall precision medicine ecosystem. Expansion of Genetic Testing The increasing availability of genetic testing is another major growth factor. Genetic tests can provide valuable information for disease diagnosis, risk assessment, treatment selection, and preventive healthcare. As testing technologies become more advanced and healthcare professionals gain greater access to genomic information, genetic testing is expected to become an increasingly important component of personalized healthcare. Growing Investment in Research and Development Pharmaceutical companies, biotechnology firms, academic institutions, and governments are increasing investments in precision medicine research. These investments support the development of new biomarkers, diagnostic platforms, genomic technologies, and personalized therapies. The expansion of clinical research involving molecular profiling and patient stratification is also strengthening the development pipeline for precision-based treatments. Latest Trends in the Precision Medicine Market Integration of Multi-Omics Precision medicine is increasingly moving beyond genomics toward a broader multi-omics approach . Researchers are combining genomic, transcriptomic, proteomic, metabolomic, and other biological datasets to obtain a more comprehensive understanding of disease. Multi-omics approaches can provide deeper insights into disease mechanisms and potentially improve patient classification and treatment selection. Growth of Companion Diagnostics Companion diagnostics are gaining importance as pharmaceutical companies develop targeted therapies. These diagnostic tools help determine whether a particular patient is likely to benefit from a specific therapy. The increasing development of drug-diagnostic combinations is expected to support the expansion of precision medicine, particularly in oncology. Personalized Cancer Treatment Cancer remains one of the most important areas for precision medicine. Tumors can contain different molecular characteristics even when they originate in the same organ. Precision oncology enables clinicians to use molecular profiling to identify specific alterations and select appropriate treatment options. The growing development of targeted therapies and immunotherapies is therefore expected to sustain demand for precision oncology solutions. Integration of Real-World Data Healthcare providers and researchers are increasingly using real-world data from electronic health records, clinical databases, patient registries, and wearable devices. Combining these data sources with genomic and molecular information can improve patient profiling and provide additional insights into treatment outcomes. Precision Medicine Market Segmentation Analysis By Technology Based on technology, the precision medicine market can be analyzed across technologies supporting genomic analysis, molecular diagnostics, bioinformatics, data analytics, and other precision healthcare applications. Advancements in sequencing technologies and molecular diagnostics are particularly important because they provide the biological information required for personalized treatment decisions. Meanwhile, AI and computational platforms are improving the ability to interpret complex datasets. By Application Based on application, the market is segmented into oncology, neurological & neurodegenerative disorders, cardiovascular disorders, immunological & autoimmune disorders, infectious diseases, respiratory diseases, metabolic & endocrine disorders, rare & genetic disorders, and others . Oncology represents a major application area due to the extensive use of genetic profiling, biomarkers, targeted therapies, and c
Sales teams can spend hours building a target account list only to discover that half the contacts are outdated, the companies do not fit the ICP, or the accounts have no reason to buy right now. A large database does not solve that problem by itself. The best Sales Intelligence Tools connect accurate company and contact records with technology usage, buying signals, enrichment, and outreach workflows. For teams selling technology or SaaS, the right platform should help answer four questions quickly: Which companies fit? Who owns the decision? What technology do they use? Why should a rep contact them now? What Should Sales Intelligence Tools Tell You About a Technology Buyer? A useful platform should turn scattered account information into a prospecting decision. It should give reps enough context to decide whether an account belongs on today's call list, not simply add another name to a spreadsheet. For technology-focused prospecting, that means combining technology intelligence with firmographic information, role data, intent activity, and contact verification. A company running a technology stack that connects closely to your product can be more relevant than a larger company with no technical fit. The same principle applies to B2B data . Volume matters less than whether the records help a rep identify the right account, the right person, and the right reason to start a conversation. Current sales intelligence guides increasingly separate contact databases, intent platforms, relationship data, and conversation intelligence because these categories solve different problems. How Does Sales Intelligence Software Work for Technology Prospecting? Sales intelligence software collects company, contact, behavioral, and technology-related information, then lets sales teams filter that information into usable prospect segments. A technology seller might start with industry, company size, geography, and job function. From there, the rep can narrow the list based on technology adoption, recent activity, hiring, or other signals that indicate potential relevance. The important point is the workflow after filtering. Data has limited value if a rep must export a list, validate every email in another application, research each company manually, and then move the records into a separate outreach platform. SalesTarget.ai approaches this workflow as one connected system. Its Lead Explorer combines 840M+ professional profiles, 146M+ business entities, 4,000+ intent signals, and 50+ data sources, with one-click enrichment for professional email, personal email, phone, and mobile information. That matters for outbound teams that want research and execution in the same workspace. Which Features Matter in a Sales Intelligence Platform? The right platform should be evaluated by the decisions it helps a rep make, not by the number of filters shown on a product page. A strong B2B sales intelligence workflow should include accurate technology intelligence platform capabilities, company and contact discovery, intent signals, enrichment, verification, CRM connectivity, and practical outreach execution. Technology data should tell you more than a company name and industry. It should help identify the systems, tools, or infrastructure associated with an account so your team can build a more relevant target segment. Company intelligence adds the business context around that technology. Firmographic details such as company size, industry, location, and organizational structure help determine whether an account fits the sales strategy. Company data becomes more useful when it can be combined with people, intent, and technology information instead of being treated as an isolated record. A platform should support this kind of filtering without forcing reps to jump between several applications. How Do You Compare Sales Intelligence Tools for Technology Intelligence? Do not compare platforms only by database size. Compare how each one helps your team move from account discovery to a qualified conversation. Data coverage and freshness A large contact data inventory can still produce poor results if records are stale. Ask how frequently records are refreshed, how email addresses are verified, and whether phone information receives similar attention. Technology and account signals A prospect intelligence layer should provide useful context around an account. Technology adoption, business changes, intent activity, hiring patterns, and other signals can help a rep decide which accounts deserve attention first. Contact quality Good lead intelligence should help identify decision-makers and relevant stakeholders rather than producing lists of people who merely match a job title. CRM and outreach workflow The strongest platforms reduce manual movement between systems. A rep should be able to identify an account, enrich the contact, verify the address, launch outreach, and track the resulting activity without rebuilding the record several times. Why Is a B2B Database Not Enough for Modern Prospecting? A B2B database answers who exists. It does not automatically answer who should be contacted today. A static record might tell you that a company has 500 employees and a VP of Engineering. That is useful, but it does not tell you whether the company uses a competing technology, has recently changed its infrastructure, or is showing activity connected to your category. A B2B company database becomes more valuable when account records can be filtered against real buying context. This changes list building from “find companies that look similar” to “find companies that fit and have a reason to engage.” That distinction is one of the biggest practical gaps in many prospecting workflows. If your reps are still exporting lists and manually researching every account before outreach, SalesTarget.ai can shorten that process by combining account discovery, enrichment, validation, intent signals, and outreach in one workspace. The goal is fewer research handoffs and more time spent on qualified conversations. What Technology Signals Should Sales Teams Track? The most useful signals depend on what your product sells and which technologies indicate a potential need. Technographic data can reveal whether an account uses a platform, infrastructure component, analytics system, CRM, marketing technology, or another solution relevant to your offer. Technographic intelligence becomes more useful when paired with account context. A technology match alone does not prove buying intent. It becomes a stronger prospecting clue when the account is also in your target segment and showing activity associated with a likely business need. Technology stack data can help reps create sharper segments. A cybersecurity vendor, for example, may want accounts running a particular cloud environment or security architecture. A sales SaaS vendor may focus on companies using a CRM but lacking a complementary workflow tool. The practical lesson is simple: technology signals should change who enters the sequence, not just add another field to a profile. How Do Buyer Intent Signals Improve Account Prioritization? Buyer intent data helps sales teams identify accounts showing research or behavioral activity related to a business category. Buyer intent signals can include research activity, content engagement, product interest, or other observable behaviors depending on the provider. These signals should not be treated as proof that a company is ready to purchase. They are prioritization inputs. Purchase intent becomes more useful when combined with fit. An account showing interest in your category but falling outside your ICP may still be a poor prospect. A well-matched account showing relevant activity deserves a closer look. SalesTarget.ai provides access to real-time buying signals through Bombora Intent Topics. Its Lead Explorer can combine those signals with business and people filters, giving reps a way to narrow broad markets into actionable account lists. How Should Reps Use Sales Prospecting Tools in a Daily Workflow? The most effective workflow starts with the account, not the contact. Step 1: Define the account criteria Set industry, company size, geography, business model, and relevant technology requirements before searching for people. This prevents reps from building large contact lists that later fail qualification. Step 2: Add technology and intent filters Use technology adoption and relevant activity to narrow the account set. A smaller list with stronger fit gives reps more context for personalization. Step 3: Identify the buying group Find the roles that influence the purchase. Do not assume the highest-ranking executive is always the right first contact. Technical, operational, finance, and business stakeholders can have different concerns. Step 4: Verify contact information A prospecting database should support current contact discovery, but verification still matters before sending outreach. SalesTarget.ai's Lead/Email Validator checks MX and SMTP signals, detects disposable addresses, and applies risk scoring. Step 5: Move qualified accounts into outreach Once an account passes the fit and data checks, connect it to the appropriate sequence. SalesTarget.ai can coordinate email and LinkedIn outreach, with conditional sequences based on responses and actions. What Are the Benefits of Combining Sales Data With Technology Signals? Sales data becomes more actionable when reps can connect it with account and technology context. The first benefit is better targeting. Reps can avoid spending equal time on every company in a broad market. The second is stronger personalization. A technology-specific observation gives a rep something more useful to reference than generic industry messaging. The third is cleaner prioritization. When account fit, contact quality, technology adoption, and buying activity appear together, sales leaders can create clearer prospecting rules. The fourth is work
The goal of guessword.io is to guess the secret word. Type any word, and the game tells you how similar it is to the secret word in meaning. Unlike other word games, this is not about spelling — it is about meaning. Similarity is scored by AI. Supports English and more languages. Play on the homepage. No account needed.The goal of guessword.io is to guess the secret word. Type any word, and the game tells you how similar it is to the secret word in meaning. Unlike other word games, this is not about spelling — it is about meaning. Similarity is scored by AI. Supports English and more languages. Play on the homepage. No account needed.
The global Injection Pen Market is becoming an important segment of the healthcare and medical devices industry as patients and healthcare providers increasingly seek convenient, accurate, and easy-to-use drug delivery solutions. Injection pens are designed to simplify the administration of injectable medications while offering greater portability, dosing accuracy, and convenience compared with traditional injection methods. The growing prevalence of chronic diseases, particularly diabetes, along with increasing demand for self-administration and minimally invasive drug delivery, is creating sustained demand for injection pen technologies. At the same time, manufacturers are developing smart and connected devices that can record doses, provide reminders, and support communication between patients and healthcare professionals. According to Kings Research, the global Injection Pen Market was valued at USD 46.32 billion in 2023 . The market is projected to grow from USD 49.20 billion in 2024 to USD 79.66 billion by 2031 , registering a CAGR of 7.13% from 2024 to 2031 . Technological advancements, affordable insulin biosimilars, and increasing emphasis on patient-centric chronic disease management are expected to support this expansion. Rising Prevalence of Chronic Diseases Drives Demand The increasing prevalence of chronic diseases is one of the primary factors driving the Injection Pen Market. Conditions such as diabetes, rheumatoid arthritis, osteoporosis, autoimmune diseases, and certain cancers can require regular administration of injectable medicines. Diabetes represents a particularly significant opportunity. According to information cited by Kings Research from the World Health Organization, approximately 422 million people worldwide live with diabetes , with the majority residing in low- and middle-income countries. For patients requiring regular injections, injection pens can provide a more convenient method of medication administration. Their compact design and controlled dosing can make them suitable for home-based treatment, allowing patients to manage certain therapies as part of their daily routines. This growing need for long-term medication management is encouraging manufacturers to focus on devices that combine accuracy with simplicity. Patient Preference for Self-Administration Supports Market Growth Healthcare delivery is increasingly shifting toward patient-centered models, particularly for chronic conditions that require long-term treatment. Patients often prefer treatment options that reduce the need for frequent visits to healthcare facilities when self-administration is clinically appropriate. Injection pens support this trend by providing a portable and relatively straightforward method for administering medication. Their design can help patients incorporate treatment into their daily lives while maintaining controlled dosing. The growing preference for minimally invasive drug delivery is also contributing to adoption. Kings Research identifies self-administration and minimally invasive delivery as significant trends supporting the market. For manufacturers, this creates an opportunity to improve ergonomics, simplify operating steps, introduce safety features, and design devices that are suitable for different patient groups. Diabetes Remains the Leading Therapy Segment Based on therapy, the Injection Pen Market is segmented into diabetes, growth hormone, osteoporosis, fertility, autoimmune diseases, cancer, and others . The diabetes segment led the market in 2023, reaching USD 13.95 billion . The large share of this segment is closely associated with the extensive use of insulin delivery systems and the growing need for convenient diabetes-management solutions. The diabetes-care ecosystem is also becoming increasingly connected. Smart injection pens can work alongside digital applications and monitoring systems to help patients track medication use and manage treatment routines. The increasing availability of insulin biosimilars is another factor influencing the market. In January 2023, Civica announced a partnership with Ypsomed AG to produce and supply insulin dosing injector pens for its lower-cost insulin products, including planned biosimilar versions of lispro, glargine, and aspart. Such developments demonstrate how affordability and device accessibility can become important elements in expanding injectable drug delivery. Smart Injection Pens Transform Medication Management One of the most important technological trends in the Injection Pen Market is the development of smart injection pens . Traditional injection pens primarily focus on delivering medication accurately. Smart devices add digital capabilities that can support dose tracking, medication reminders, connectivity, and data sharing. These features can be particularly useful for chronic disease management, where adherence to a prescribed treatment schedule can be an important part of effective care. Connected injection pens can potentially help patients maintain a record of administered doses while giving healthcare professionals greater visibility into medication-use patterns. This creates opportunities for more informed treatment management and personalized healthcare. Kings Research highlights the growing adoption of digital connectivity and tracking capabilities as a major market trend. For example, in October 2022, Merck KGaA extended its collaboration with Biocorp to develop a Bluetooth-enabled clip-on device for one of its drug delivery systems. As digital health ecosystems continue to develop, connected injection devices are likely to become increasingly integrated with mobile applications and other healthcare technologies. Automated Injection Pens Improve User Convenience The market is also witnessing increasing interest in automated injection technologies designed to simplify medication administration. According to Kings Research, the fully automated injection pens segment accounted for 64.56% of the market in 2023 . These devices can simplify administration through automated dosing and injection mechanisms while incorporating safety-oriented features. Automation can be particularly valuable for patients who experience difficulties handling conventional injection devices. Manufacturers are therefore focusing on designs that reduce complexity while maintaining accurate delivery. An example of this trend occurred in February 2023, when AstraZeneca and Amgen's Tezspire received U.S. approval for self-administration using a pre-filled, single-use pen for eligible patients aged 12 and above with severe asthma. The development reflects the broader movement toward convenient, patient-oriented delivery systems. Sustainability Becomes Increasingly Important Environmental sustainability is becoming another consideration in injection pen development. Because many injection devices contain multiple components and may be used repeatedly or discarded after use, manufacturers are exploring ways to address their environmental impact. Kings Research highlights initiatives aimed at improving the end-of-life management of injection pens. In September 2023, Sanofi reported initiatives focused on collecting and recycling used injection pens. The company had launched take-back programs in several countries and collaborated with pharmacies in Germany to collect used SoloStar pens. Such programs demonstrate how sustainability is increasingly becoming part of medical-device development. Future product designs may place greater emphasis on recyclable materials, reduced material consumption, reusable components, and improved disposal systems while maintaining safety and regulatory requirements. Hospitals and Diagnostic Centers Represent a Major End-User Segment Based on end user, the Injection Pen Market is divided into hospitals & diagnostic centers and homecare settings . Kings Research projects that the hospitals and diagnostic centers segment will reach approximately USD 55.83 billion by 2031 . Growing demand for user-friendly delivery systems, increased use of biologics and biosimilars, and improvements in injection technology are contributing to segment growth. However, homecare is also an important part of the market's long-term development. As self-administration becomes more common, injection pens can support treatment outside traditional healthcare facilities. The expansion of home-based healthcare can also reduce the need for patients to travel frequently for routine medication administration when self-injection is medically appropriate. North America Maintains a Strong Market Position North America represented approximately 36.97% of the global Injection Pen Market in 2023 , with a market value of USD 17.12 billion . The region benefits from advanced healthcare infrastructure, strong pharmaceutical and medical-device industries, and significant demand for chronic disease management technologies. The increasing availability of biologics and biosimilars is also supporting demand for advanced delivery systems. Meanwhile, digital health adoption is encouraging the development of connected devices that can provide additional functionality beyond basic medication administration. Patient awareness, healthcare accessibility, and technological innovation are expected to continue supporting the regional market. Asia-Pacific Emerges as the Fastest-Growing Region Asia-Pacific is expected to experience the fastest growth in the Injection Pen Market during the forecast period. Kings Research projects a CAGR of 8.14% from 2024 to 2031 , with the regional market expected to reach approximately USD 18.74 billion by 2031 . Rapid urbanization, increasing healthcare awareness, rising disposable incomes, and improvements in healthcare infrastructure are supporting adoption across countries including China, India, Japan, and South Korea. The region's large population also creates significant potential for chronic disease management solutions. Gove
https://drive.google.com/file/d/1L2DidPqyDVTgPP9SY4CG-K3zYvkptHei/view?usp=sharing 플레이가 가능한 정도로만 검수되어있습니다. 압축을 풀고 Apply Korean Patch.cmd 를 실행하면 됩니다. 한글패치를 풀려면 Restore Original.cmd를 실행하면 됩니다. tsv 파일은 번역 시트로, 이걸 수정한다고 해서 반영되는 건 아닙니다. 무시하시면 됩니다.
오 내일은 스타트업에서 AI쓰는거 알려준다함 뭐지 코테같은거나 뭐 준비하는건가! 어떤흐름으로 개발하는거? 인거같기도 음음 좋은데 좋은데 CS면접 문제 인터뷰 https://github.com/gyoogle/tech-interview-for-developer 여기서 CS공부 ᄀᄀ daily 3ea 리트코드(SQL) 장기실행에대한 eval이 어려움 Airflow 를 쓰자쓰자 복잡한 데이터 파이프라인과 워크플로우를 프로그래밍 방식으로 작성, 스케줄링, 모니터링할 수 있는 오픈소스 Apache Airflow 데이터 오케스트레이션 플랫폼입니다. 으아아아악 머리아파!!!!!!!!!!!!!!!!!!!!!!!!!!!!!!!!!!!!!!!!!!!!!!!!!!!!!!!!!!!!!!!!!!!!!!!!!!!!!!!!!!!!!!!!!!!!!!!!!!!!!!!!!!!!!!!!!!!!!!!!!!!!!!!!!!!!!!!!!!!!!!!!!!!!!!!!!!!!!!!!!!!!!!!!!!!!!!!!!!!!!!
비즈니스 분석 프레임워크 분석 방법 핵심 질문 주요 목적 퍼널 분석 어느 단계에서 사용자가 많이 이탈하는가? 전환 과정의 문제점 진단 코호트 분석 특정 집단의 행동이 시간에 따라 어떻게 달라지는가? 사용자 행동 변화 및 리텐션 분석 RFM 분석 어떤 고객이 우리에게 중요한 고객인가? 고객 세그멘테이션 및 마케팅 전략 수립 1. 퍼널 분석(Funnel Analysis) 사용자가 특정 목표를 달성하기까지의 경로를 여러 단계로 나누어 분석하는 방법 각 단계에서 얼마나 많은 사용자가 다음 단계로 이동하거나 이탈하는지 확인하여 개선이 필요한 단계를 진단 예) 상품 조회 → 장바구니 → 결제 완료 2. 코호트 분석(Cohort Analysis) 특정 시점이나 특성, 행동 등 공통된 기준을 가진 사용자 집단(코호트)의 행동을 시간의 흐름에 따라 비교 및 분석하는 방법 코호트(Cohort)를 나누는 기준 시점 기반 가입일, 첫 구매일 등 특정 시점을 기준으로 구분 특성 기반 연령, 지역 등 사용자의 특성을 기준으로 구분 행동 기반 특정 기능 사용 여부, 특정 상품 구매 여부 등 사용자의 행동을 기준으로 구분 리텐션(Retention) 측정 방식 클래식 리텐션(Classic Retention) 범위 리텐션(Range Retention) 롤링 리텐션(Rolling Retention) 3. RFM 분석(RFM Analysis) 고객의 구매 행동을 R, F, M 세 가지 기준으로 평가하여 고객을 세분화하는 분석 방법 R — Recency(최근성) : 고객의 마지막 구매 이후 얼마나 시간이 지났는가? F — Frequency(빈도) : 고객이 얼마나 자주 구매했는가? M — Monetary(금액) : 고객이 얼마나 많은 금액을 구매에 사용했는가? Recency 예시 현재 날짜가 2026년 9월 28일이라고 가정해 봅시다. 유저 A : 마지막 구매일 9월 27일 → Recency = 1일 유저 B : 마지막 구매일 9월 25일 → Recency = 3일 → 일반적으로 Recency 값이 작을수록 최근에 구매한 고객이고, RFM 점수로 변환할 때는 최근에 구매한 고객에게 높은 점수를 부여 RFM 점수 예시 유저 R F M Cell 합계 평균 유저 A 5 2 5 (5, 2, 5) 12 4.0 유저 B 2 5 5 (2, 5, 5) 12 4.0 두 고객 모두 합계는 12점으로 동일하지만, Cell을 살펴보면 두 고객의 특성이 다름 유저 A (5, 2, 5) → 최근 구매했고 구매 금액은 높지만 구매 빈도는 낮음 유저 B (2, 5, 5) → 최근 구매는 아니지만 구매 빈도와 구매 금액이 높음 RFM 점수를 활용하는 방법 합계 또는 평균 활용 장점 : 계산과 해석이 간단함 단점 : R, F, M 각각의 세부적인 특징을 놓칠 수 있음 Cell 활용 (R, F, M) 의 조합을 기준으로 고객을 구분 장점 : 고객의 세부적인 특성을 고려할 수 있음 단점 : 점수 단계가 많아질수록 조합이 많아져 복잡해짐 R, F, M을 각각 5단계로 구분한다면 최대 5 × 5 × 5 = 125개의 Cell이 만들어질 수 있음. 실제 분석에서는 비즈니스 목적에 맞게 여러 Cell을 묶어 VIP 고객, 충성 고객, 이탈 위험 고객 등의 세그먼트로 정의하여 활용 RFM 분석의 활용 RFM 분석을 통해 고객을 세그먼트로 나눈 후, 각 고객군의 특성에 맞는 마케팅 전략을 적용할 수 있습니다. 참고 업셀링(Upselling) : 고객이 고려하고 있는 상품보다 더 높은 가격이나 사양의 상품을 구매하도록 유도하는 전략 예) 빽다방 : 아이스 아메리카노 → 빅사이즈 아이스 아메리카노 노트북 : 기본 사양 LG그램 → 더 높은 사양의 LG그램 크로스셀링(Cross-selling) : 고객이 구매하려는 상품과 관련된 다른 상품을 함께 구매하도록 유도하는 전략 예) 맥도날드: 상하이 스파이시 버거 → 버거 + 감자튀김 + 음료 세트